SLO County’s drought designation remains, despite drenching
January 5, 2023

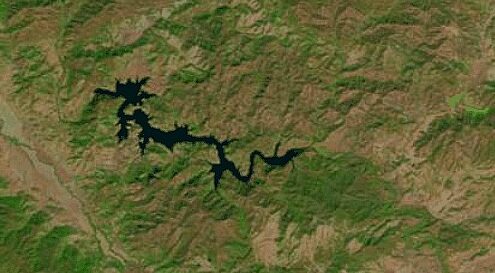
Santa Margarita Lake
BY KAREN VELIE
Even though storms have pushed rainfall totals well above average for the first week of January, San Luis Obispo County continues with drought conditions ranging from moderate to extreme, according to the U.S. Drought Monitor.
During the past 24 hours, the latest storm brought between .82 of an inch in Oceano to 3.94 inches in Rocky Butte – a mountain northeast of Cambria.
Climate scientists track rain from July 1 through June 31. Rainfall totals at Rocky Butte have already exceeded yearly averages, according to averages listed on the SLO County monthly precipitation reports. Rain totals have averaged more than 150% of normal across central California, according to the monitor.
Even so, SLO County remains with drought conditions ranging from moderate to extreme, according to the monitor.
Despite the heavy rains, two area reservoirs remain below the 60% capacity expected at this time of year.
Current SLO County and major state reservoir levels:
- Santa Margarita Lake at 79.2%, SLO County
- Lake Nacimiento at 38%, SLO County
- Lopez Lake at 25.5%, SLO County
- Whale Rock Reservoir at 72.85%, SLO County
- Oroville Dam 39%, Butte County
- Trinity Lake at 23%, Trinity County
- Don Pedro Reservoir at 62%, Mariposa County
- Shasta Dam at 34%, Shasta County
- San Luis Reservoir at 36%, Merced County
Rainfall totals from July 1 through Jan. 5, along with average yearly rainfall:
Arroyo Grande – 12.72 inches to date – average 14.09 inches
Atascadero – 10.91 inches to date – average 12.06 inches
Lopez Dam – 17.97 inches to date – average 18.48 inches
Los Osos – 14.13 inches to date – average 15.77 inches
Nipomo – 9.58 inches to date – average 12.62 inches
Oceano – 11.01 inches to date – average 12.26 inches
Rocky Butte – 39.12 inches to date – average 34.75 inches
San Luis Obispo – 11.25 inches to date – average 16.82 inches
San Simeon – 13.27 inches to date – average 15.12 inches
Santa Margarita – 16.32 inches to date – average 16.96 inches
Shandon – 7.64 inches to date – average 8.44 inches
Templeton – 12.29 inches to date – average 13.05 inches


The comments below represent the opinion of the writer and do not represent the views or policies of CalCoastNews.com. Please address the Policies, events and arguments, not the person. Constructive debate is good; mockery, taunting, and name calling is not. Comment Guidelines